The Distribution of Income and Wealth in Advanced Economies
Growing house prices in the United States, the United Kingdom, and elsewhere have rendered the dream of owning a house -- the most common form of wealth – out of reach for many of the young and called to mind the important difference between income and wealth. In cities like London even well-paid, well-educated employees cannot afford to obtain housing anymore;[i] instead, to buy homes in UK’s most desirable areas, the young increasingly depend on inheritances and support from family members calling into question the very idea of a meritocratic system. This empirical observation stands in stark contrast to the academic literature that in large part has studied economic inequality through the lens of income inequality – a concept that is easier to measure than the unequal distribution of assets (see this previous blogpost). This blogpost sheds light on some facts about the differences in the distribution of income and wealth across countries and over time.
Wealth and income inequality are obviously positively associated: individuals that earn higher wages are able to save more and thus become wealthier. But an individual’s wealth does not only depend on her current income, but also on her past income as well as bequests received from the parents’ generation. Hence the correlation between both concepts of inequality is not perfect. For instance, retirees usually receive low incomes from labor, but have accumulated relatively high levels of wealth; younger people might earn high labor wages but might not yet have inherited the wealth from their parents’ generation.
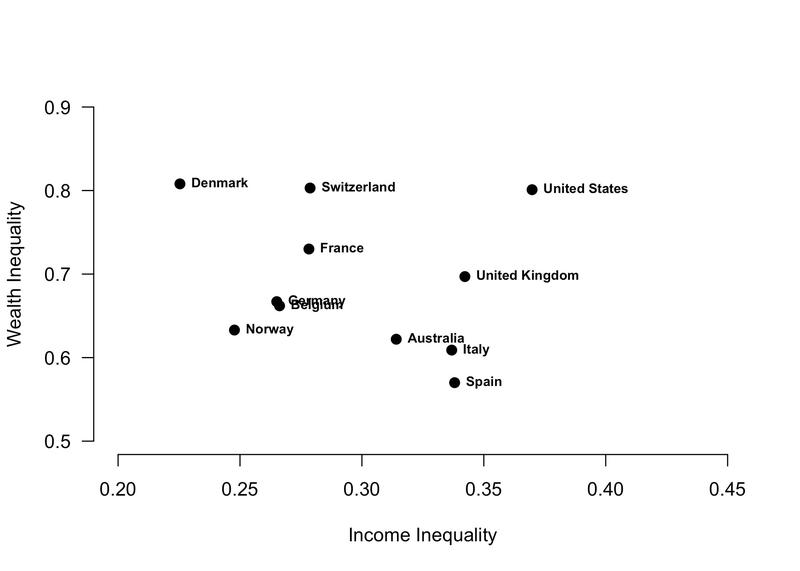
The distribution of wealth and income varies across countries, too. Figure 1 combines income and wealth inequality data from eleven advanced market economies for the year of 2000. It relies on Gini data from the Standardized World Income Inequality Database[ii] (income inequality) and a study by a number of economists (wealth inequality).[iii] It shows that, as expected, net income inequality (i.e. post-fiscal inequality) is low in Scandinavian countries and high in liberal market economies such as the US and the UK. While this is partly explained by lower levels of fiscal redistribution, higher income differences in those countries matter too. A closer look at the relationship between wealth and income inequality across countries however reveals an interesting pattern, namely the absence of a clear pattern: Countries with higher income inequality levels do not necessarily have higher wealth inequality. Take, for instance, Denmark: The country has the lowest income Gini coefficient of all eleven countries but exhibits the highest level of wealth inequality. In contrast, Spain – a country with a relatively high level of income inequality – is the country with the lowest wealth Gini coefficient. The US are thus an exception in combining an extremely high level of wealth and income inequality. Extensive academic literature addresses the determinants of wealth inequality across countries and a detailed examination would beyond the scope of this blogpost, but private indebtedness and homeownership, a comparatively equally distributed asset, play an important role.
The scatterplot illustrates another important, but intuitive fact: In all countries, wealth inequality is much higher than income inequality. The Gini coefficient for the wealth distribution ranges between 0.6—0.8 across all countries whereas the income Gini coefficient is between 0.2—0.4. That highlights that there are many more people that have no or negative wealth (i.e. debt) than individuals that have no income.

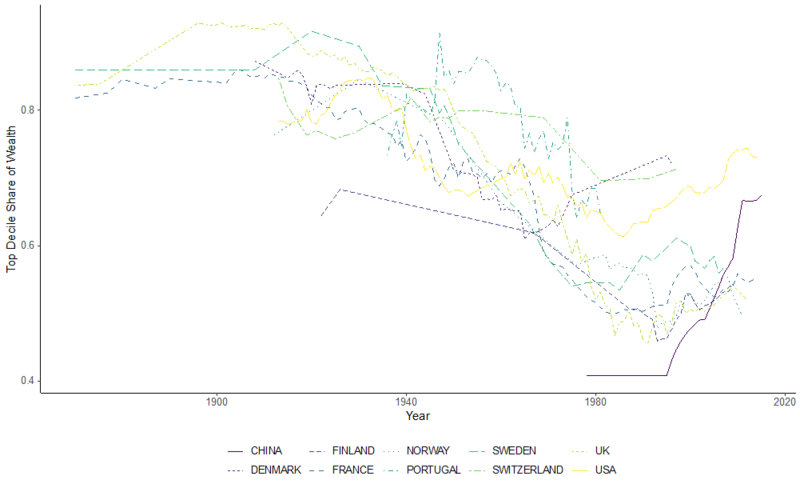
In recent years, academic studies have made headlines by presenting evidence of the growing gap between incomes of the poor and middle class, on the one hand, and the very rich, on the other. Especially in the US, top incomes grew much faster than average incomes. Are assets also increasingly concentrated at the top? To elucidate this question, Figure 2 combines longitudinal data from the World Inequality Database[iv] and Waldenstrom & Roine[v] on the share of wealth that is owned by the top-10% in the wealth distribution in ten key economies. While the availability of data for countries varies over time, the figure illustrates a declining trend in the concentration of wealth between 1940 and today. In the UK, for instance, 80 percent of all wealth was concentrated in the hands of the top decile of the wealth distribution in 1940; today this share is well below 60 percent. In the US, the share of wealth in the hands of the wealthiest households also declined since World War II but is moderately rising since the early 1980s and shows the highest level today of all ten countries. China seems to be a clear exception to the broader trend with a strong increase in the share of wealth claimed by the top decile; yet, it also constitutes a political and economic outlier as an emerging economy.
To sum up, a more careful distinction between the distribution of wealth and income across countries and over time is in order. Most existing research equates economic inequality with income inequality, yet this might not fully grasp its political, social, and economic implications. Some more recent work addresses the empirical challenges of measuring the different forms of wealth[vi] paving the way for a more careful study of the political consequences of different assets and asset price booms. Moreover, scholarship that solely focuses on the case of the United States might fall short of understanding the more general effects of wealth and income inequality: As Figure 1 and 2 illustrate, the US seem to constitute an exception in combining high levels of wealth and income inequality today. WEALTHPOL studies the different facets of economic inequality more systematically and explicitly looks at wealth inequality compared to income inequality; by studying the subject in various advanced economies, we moreover put the (perhaps exceptional) case of the US into perspective.

Figure 2: Top 10% Wealth Shares over time
[i] Brooker, Nathan: ‘London Housing: too hot for young buyers.’, Financial Times; April 27, 2017; URL: https://www.ft.com/content/a0182e62-25e4-11e7-a34a-538b4cb30025 (accessed: April 28, 2019).
[ii] Solt, Frederick. 2019. “Measuring Income Inequality Across Countries and Over Time: The Standardized World Income Inequality Database.” SWIID Version 8.0, February 2019.
[iii] James B. Davies & Susanna Sandström & Anthony Shorrocks & Edward N. Wolff, 2011. "The Level and Distribution of Global Household Wealth," Economic Journal, Royal Economic Society, vol. 121(551), pages 223-254
[iv] Alvaredo, F., Chancel, L., Piketty, T., Saez, E., & Zucman, G. (2018). World inequality database. URL: https://wid.world (accessed: April 28, 2019)
[v] Roine, Jesper and Daniel Waldenström. 2015. Long-run trends in the distribution of income and wealth. In: ‘Handbook of income distribution’. Vol. 2 Elsevier pp. 469–592.
[vi] See, for instance, Kuhn, Moritz, Moritz Schularick, and Ulrike Steins (2019): ‘Wealth and Income Inequality in America, 1949—2016.’ Working Paper, URL: http://www.wiwi.uni-bonn.de/kuhn/paper/Wealthinequality_April2019.pdf (accessed: April 28, 2019).


